Capital Funds
|
||
Equity contribution of owners. The
basic approach of capital adequacy framework is that a bank should have
sufficient capital to provide a stable resource to absorb any losses arising
from the risks in its business. Capital is divided into different tiers
according to the characteristics / qualities of each qualifying instrument.
For supervisory purposes capital is split into two categories: Tier I and
Tier II.
|
||
Tier I Capital
|
||
A term used to refer to one of the
components of regulatory capital. It consists mainly of share capital and
disclosed reserves (minus goodwill, if any). Tier I items are deemed to be of
the highest quality because they are fully available to cover losses Hence it
is also termed as core capital.
|
||
Tier II Capital
|
||
Refers to one of the components of
regulatory capital. Also known as supplementary capital, it consists of
certain reserves and certain types of subordinated debt. Tier II items
qualify as regulatory capital to the extent that they can be used to absorb losses
arising from a bank's activities. Tier II's capital loss absorption capacity
is lower than that of Tier I capital.
|
||
Revaluation reserves
|
||
Revaluation reserves are a part of
Tier-II capital. These reserves arise from revaluation of assets that are undervalued
on the bank's books, typically bank premises and marketable securities. The
extent to which the revaluation reserves can be relied upon as a cushion for
unexpected losses depends mainly upon the level of certainty that can be
placed on estimates of the market values of the relevant assets and the
subsequent deterioration in values under difficult market conditions or in a
forced sale.
|
||
Leverage
|
||
Ratio of assets to capital.
|
||
Capital reserves
|
||
That portion of a company's profits
not paid out as dividends to shareholders. They are also known as
undistributable reserves and are ploughed back into the business.
|
||
Deferred Tax Assets
|
||
Unabsorbed depreciation and carry
forward of losses which can be set-off against future taxable income which is
considered as timing differences result in deferred tax assets. The deferred
Tax Assets are accounted as per the Accounting Standard 22.
|
||
Deferred Tax Liabilities
|
||
Deferred tax liabilities have an
effect of increasing future year's income tax payments, which indicates that
they are accrued income taxes and meet definition of liabilities.
|
||
Subordinated debt
|
||
Refers to the status of the debt. In
the event of the bankruptcy or liquidation of the debtor, subordinated debt
only has a secondary claim on repayments, after other debt has been repaid.
|
||
Hybrid debt capital instruments
|
||
In this category, fall a number of
capital instruments, which combine certain characteristics of equity and
certain characteristics of debt. Each has a particular feature, which can be
considered to affect its quality as capital. Where these instruments have
close similarities to equity, in particular when they are able to support
losses on an ongoing basis without triggering liquidation, they may be
included in Tier II capital.
|
||
BASEL Committee on Banking
Supervision
|
||
The BASEL Committee is a committee of
bank supervisors consisting of members from each of the G10 countries. The
Committee is a forum for discussion on the handling of specific supervisory
problems. It coordinates the sharing of supervisory responsibilities among
national authorities in respect of banks' foreign establishments with the aim
of ensuring effective supervision of banks' activities worldwide.
|
||
Market Discipline
|
||
Market Discipline seeks to achieve
increased transparency through expanded disclosure requirements for banks.
|
||
Mortgage Back Security
|
||
A bond-type security in which the
collateral is provided by a pool of mortgages. Income from the underlying
mortgages is used to meet interest and principal repayments.
|
||
Derivative
|
||
A derivative instrument derives its
value from an underlying product. There are basically three derivatives
a) Forward Contract- A forward contract is an agreement between two parties to buy or sell an agreed amount of a commodity or financial instrument at an agreed price, for delivery on an agreed future date. Future Contract- Is a standardized exchange tradable forward contract executed at an exchange. In contrast to a futures contract, a forward contract is not transferable or exchange tradable, its terms are not standardized and no margin is exchanged. The buyer of the forward contract is said to be long on the contract and the seller is said to be short on the contract. b) Options- An option is a contract which grants the buyer the right, but not the obligation, to buy (call option) or sell (put option) an asset, commodity, currency or financial instrument at an agreed rate (exercise price) on or before an agreed date (expiry or settlement date). The buyer pays the seller an amount called the premium in exchange for this right. This premium is the price of the option. c) Swaps- Is an agreement to exchange future cash flow at pre-specified Intervals. Typically one cash flow is based on a variable price and other on affixed one. |
||
Non Performing Assets (NPA)
|
||
An asset, including a leased asset,
becomes non performing when it ceases to generate income for the bank.
|
||
Net NPA
|
||
Gross NPA – Total provisions held.
|
||
Substandard Assets
|
||
A substandard asset would be one, which
has remained NPA for a period less than or equal to 12 months. Such an asset
will have well defined credit weaknesses that jeopardize the liquidation of
the debt and are characterised by the distinct possibility that the banks
will sustain some loss, if deficiencies are not corrected.
|
||
Doubtful Asset
|
||
An asset would be classified as
doubtful if it has remained in the substandard category for a period of 12
months. A loan classified as doubtful has all the weaknesses inherent in
assets that were classified as substandard, with the added characteristic
that the weaknesses make collection or liquidation in full, - on the basis of
currently known facts, conditions and values - highly questionable and
improbable.
|
||
Loss Asset
|
||
A loss asset is one where loss has
been identified by the bank or internal or external auditors or the RBI
inspection but the amount has not been written off wholly. In other words,
such an asset is considered uncollectible and of such little value that its
continuance as a bankable asset is not warranted although there may be some
salvage or recovery value.
|
||
Off Balance Sheet Exposure
|
||
Off-Balance Sheet exposures refer to
the business activities of a bank that generally do not involve booking
assets (loans) and taking deposits. Off-balance sheet activities normally
generate fees, but produce liabilities or assets that are deferred or
contingent and thus, do not appear on the institution's balance sheet until
and unless they become actual assets or liabilities.
|
||
Net Interest Income ( NII)
|
||
The NII is the difference between the
interest income and the interest expenses.
|
||
Net Interest Margin
|
||
Net interest margin is the net
interest income divided by average interest earning assets.
|
||
Return on Asset (ROA)- After Tax
|
||
Return on Assets (ROA) is a
profitability ratio which indicates the net profit (net income) generated on
total assets. It is computed by dividing net income by average total assets.
Formula- (Profit after tax/Av. Total assets)*100
|
||
Return on equity (ROE)- After Tax
|
||
Return on Equity (ROE) is a ratio
relating net profit (net income) to shareholders’ equity. Here the equity
refers to share capital reserves and surplus of the bank. Formula- Profit
after tax/(Total equity + Total equity at the end of previous year)/2}*100
|
||
CASA Deposit
|
||
Deposit in bank in current and Savings
account.
|
||
Liquid Assets
|
||
Liquid assets consists of: cash,
balances with RBI, balances in current accounts with banks, money at call and
short notice, inter-bank placements due within 30 days and securities under
“held for trading” and “available for sale” categories excluding securities
that do not have ready market.
|
||
ALM
|
||
Asset Liability Management (ALM) is
concerned with strategic balance sheet management involving all market risks.
It also deals with liquidity management, funds management, trading and
capital planning.
|
||
ALCO
|
||
Asset-Liability Management Committee
(ALCO) is a strategic decision making body, formulating and overseeing the
function of asset liability management (ALM) of a bank.
|
||
Venture Capital Fund
|
||
A fund set up for the purpose of
investing in startup businesses that is perceived to have excellent growth
prospects but does not have access to capital markets.
|
||
Held Till Maturity(HTM)
|
||
The securities acquired by the banks
with the intention to hold them up to maturity.
|
||
Held for Trading(HFT)
|
||
Securities where the intention is to
trade by taking advantage of short-term price / interest rate movements.
|
||
Available for Sale(AFS)
|
||
The securities available for sale are
those securities where the intention of the bank is neither to trade nor to
hold till maturity. These securities are valued at the fair value which is
determined by reference to the best available source of current market
quotations or other data relative to current value.
|
||
Yield to maturity (YTM) or Yield
|
||
The Yield to maturity (YTM) is the
yield promised to the bondholder on the assumption that the bond will be held
to maturity and coupon payments will be reinvested at the YTM. It is a
measure of the return of the bond.
|
||
CRR
|
||
Cash reserve ratio is the cash parked
by the banks in their specified current account maintained with RBI.
|
||
SLR
|
||
Statutory liquidity ratio is in the
form of cash (book value), gold (current market value) and balances in
unencumbered approved securities.
|
||
LIBOR
|
||
London Inter Bank Offered Rate. The
interest rate at which banks offer to lend funds in the interbank market.
|
||
Basis Point
|
||
Is one hundredth of one percent. 1
basis point means 0.01%. Used for measuring change in interest rate/yield.
|
||
Fraud
|
||
Frauds have been classified as under,
based mainly on the provisions of the Indian Penal Code
(a) Misappropriation and criminal breach of trust. (b) Fraudulent encashment through forged instruments, manipulation of books of account or through fictitious accounts and conversion of property. (c) Unauthorised credit facilities extended for reward or for illegal gratification. (d) Negligence and cash shortages. (e) Cheating and forgery. (f) Irregularities in foreign exchange transactions. (g) Any other type of fraud not coming under the specific heads as above. |
||
Securitization
|
||
A process by which a single asset or a
pool of assets are transferred from the balance sheet of the originator
(bank) to a bankruptcy remote SPV (trust) in return for an immediate cash
payment.
|
||
Special Purpose Vehicle (SPV)
|
||
An entity which may be a trust,
company or other entity constituted or established by a ‘Deed’ or ‘Agreement’
for a specific purpose.
|
||
Bankruptcy remote
|
||
The legal position with reference to
the creation of the SPV should be such that the SPV and its assets would not
be touched in case the originator of the securitization goes bankrupt and its
assets are liquidated.
|
||
Commercial real estate
|
||
commercial real estate is defined as
“fund based and non-fund based exposures secured by mortgages on commercial
real estates (office buildings, retail space, multi-purpose commercial
premises, multi-family residential buildings, multi-tenanted commercial
premises, industrial or warehouse space, hotels, land acquisition,
development and construction etc.)”
KYC
Norms & Anti Money laundering
Measures in Banking
Objectives:
1.
Protect banks from
financial frauds and from being used
by criminals who are engaged in
money laundering
2.
Make Bank
employees understand their
customers better and their financial dealings and to manage any risk associated prudently
3.
To
strengthen customer
identification and monitoring of
accounts
Policy:
Customer Acceptance
Customer Identification procedure
Monitoring of transactions
Monitoring and reporting suspicious activities
FIU-IND ( Financial Intelligence Unit of India)
STR – Suspicious Transaction Report
Marketing
and Banking specialization:
Marketing covers not only goods but also services. Banking is also a
service industry where the
concepts and application of marketing is used. Banks are relatively new to marketing. As Banking industry shifted from class
banking to mass banking , the needs and
wants of their customers
multiplied.
Also in view of large numbers of existing banks as well as new banks coming up the competition intensified in
the market. These developments contributed in the development of the marketing approach
among banks.
Marketing in Banks is the process of
satisfying the financial and banking needs and wants of customers
Different types of Deposits
Different types of loans and advances
What is MSME ?- Micro, Small and Medium
Enterprises
Priority sector loans are those loans
given to borrowers specified by
RBI under its s priority sector lending
guidelines for loans to
Agriculture, Small Scale Industries, Retail trade, Water/Transport operators,
Professional and self employed , Housing Loans ( upto 25 lacs) etc. Every Bank has to lend 40 %
of their lendable resources to
this sector.
Retail loans are those that are given
to customers such as Home Loans , Car Loans, Personal loans, Gold loans etc.
ECS :Electronic Clearing System is an
electronic payment /receipt for
transactions that are repetitive and
periodical in nature. ECS enables bulk
transfer of funds from one bank account to many bank accounts or vice
versa- ECS Debit and ECS Credit
Bank Computerisation was mooted by
which Committee: Dr C Rangarajan
MICR : Magnetic Ink Character
recognition
NEFT:/ RTGS
Why Banking
as a career?
It is expected that Indian
Economy register a double digit growth during the next two to three decades. This provides enormous
amount of challenges and
opportunities for the growth of the
banking sector within India
56.90% of India’s population belongs to the age group of 15-59 years . We have only 7.50 % of the population belonging to the age category above 60 years.
The population growth will increase
and in future there will a very good
demand for retail banking products.
More over the next challenge is
financial inclusion, ie banking for all ..
Technology leveraging is maximum done
in banking sector.
All these are giving a lot of
opportunities for a structured career growth. I am sure that
I also can grow with the growth and development of the
banking system.
Banking sector gives an
opportunity for continuous learning
including the latest technology. That means we can always travel with
the technology . The educational and training opportunities provided by Banks are enormous.
India vision 2020 says India will become 4th largest
economy. I am sure that Banks will have a
substantial part to play in
this progress. I also want to be a
part of this process by working in a Bank.
Inflation refers to a persistent rise in prices.
Simply put , it is a situation of too much money and too few goods. Thus due to scarcity of goods and presence of many buyers , the prices are pushed up.
ASBA
Application supported by Blocked
Amounts- used an alternative
payment system in IPO applications. No need of sending money with application. Simply block it in
the respective accounts and earn
interest.
ALM – Asset Liability Management is a comprehensive framework for measuring, monitoring and
managing the market risk of a bank. It is the management
of structure of balance sheet ( liabilities and assets) in
such a way that the net earnings is maximized.
Base rate : is for the Banks to set a
level of minimum interest rates charged while giving out the loans.
IFSC Code: Indian Financial System
Code: used for interbank transfers through NEFT and RTGS.
Financial inclusion is the delivery
of financial services at affordable costs to sections of disadvantaged and low income segments of society.
|
||
Thursday, October 8, 2015
BANKING TERMINOLOGIES
Tuesday, October 6, 2015
INVENTORY VALUATION
Introduction to Inventory
and Cost of Goods Sold
Inventory is merchandise purchased by merchandisers (retailers,
wholesalers, distributors) for the purpose of being sold to customers. The cost
of the merchandise purchased but not yet sold is reported in the account
Inventory or Merchandise Inventory.
Inventory is reported as a current asset on the company's balance sheet. Inventory is a significant asset
that needs to be monitored closely. Too much inventory
can result in cash flow problems, additional expenses (e.g., storage,
insurance), and losses if the items become obsolete. Too little inventory
can result in lost sales and lost customers.
Because of the cost principle, inventory is reported on the balance sheet at the amount
paid to obtain (purchase) the merchandise, not at its selling price.
Inventory is also a significant asset of manufacturers. However,
in order to simplify our explanation, we will focus on a retailer.
Cost of Goods Sold
Cost of goods sold is the cost of the
merchandise that was sold to customers. The cost of goods
sold is reported on the income statement when the
sales revenues of the goods sold are reported.
A retailer's cost of goods sold
includes the cost from its supplier plus any
additional costs necessary to get the merchandise into inventory and ready for
sale. For example, let's assume that Corner Shelf Bookstore purchases a college
textbook from a publisher. If Corner Shelf's cost from the publisher is $80 for
the textbook plus $5 in shipping costs, Corner Shelf reports $85 in its
Inventory account until the book is sold. When the book is sold, the $85 is
removed from inventory and is reported as cost of goods sold on the income
statement.
When Costs Change
If the publisher increases the
selling prices of its books, the bookstore will have a higher cost for
the next book it purchases from the publisher. Any books in the
bookstore's inventory will continue to be reported at their cost when
purchased. For example, if the Corner Shelf Bookstore has on its shelf a book
that had a cost of $85, Corner Shelf will continue to report the cost of that
one book at its actual cost of $85 even if the same book now has a cost of $90.
The cost principle will not allow an amount higher than cost to be included in
inventory.
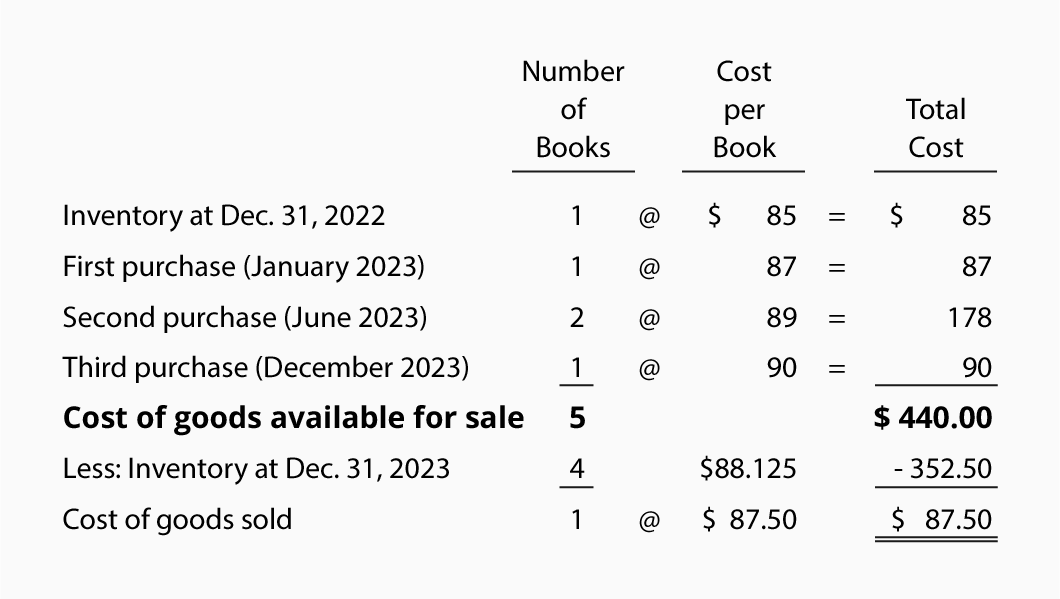
Let's assume the Corner Shelf Bookstore had one book in
inventory at the start of the year 2014 and at different times during 2014
purchased four identical books. During the year 2014 the cost of these books
increased due to a paper shortage. The following chart shows the costs of the
five books that have to be accounted for. It also assumes that none of the
books has been sold as of December 31, 2014.

Special Feature: Review what you are
learning by working the three interactive crossword puzzles dedicated to this
topic. They are completely free. Inventory & Cost of Goods Sold Puzzles
Cost Flow Assumptions
If the Corner Shelf Bookstore sells only one of the five books,
which cost should Corner Shelf report as the cost of goods sold? Should it
select $85, $87, $89, $89, $90, or an average of the five amounts? A related
question is which cost should Corner Shelf report as inventory on its balance
sheet for the four books that have not been sold?
Accounting rules allow the
bookstore to move the cost from inventory to the cost of goods sold by using
one of three cost flows:
- First
In, First Out (FIFO)
- Last
In, First Out (LIFO)
- Average
Note that these are cost flow
assumptions. This means that the order in which costs are
removed from inventory can be different from the order in which the goods are
physically removed from inventory. In other words, Corner Shelf could sell the
book that was on hand at December 31, 2013 but could remove from inventory the
$90 costof the book purchased in December 2014 (if it elects the LIFO
cost flow assumption).
Inventory Systems
Each of the three cost flow assumptions listed above
can be used in either of two systems (or methods) of inventory:
A. Periodic
B. Perpetual
B. Perpetual
A. Periodic inventory system. Under this system the amount
appearing in the Inventory account is not updated when purchases of merchandise
are made from suppliers. Rather, the Inventory account is commonly updated or
adjusted only once—at the end of the year. During the year the Inventory
account will likely show only the cost of inventory at the end of the previous
year.
Under the periodic inventory
system, purchases of merchandise are recorded in one or more Purchasesaccounts.
At the end of the year the Purchases account(s) are closed and the Inventory
account is adjusted to equal the cost of the merchandise actually on hand at
the end of the year. Under the periodic system there is noCost of Goods Sold account
to be updated when a sale of merchandise occurs.
In short, under the periodic inventory system there is
no way to tell from the general ledger accounts the amount of inventory or the
cost of goods sold.
B. Perpetual inventory system. Under this system the
Inventory account is continuously updated. The Inventory account is increased
with the cost of merchandise purchased from suppliers and it is reduced by the
cost of merchandise that has been sold to customers. (The Purchases account(s)
do not exist.)
Under the perpetual system there is a Cost of Goods
Sold account that is debited at the time of each sale for the cost of the
merchandise that was sold. Under the perpetual system a sale of merchandise
will result in two journal entries: one to record the sale and the cash or
accounts receivable, and one to reduce inventory and to increase cost of goods
sold.
Inventory Systems and Cost Flows
Combined
The combination of the three cost flow assumptions and
the two inventory systems results in six available options when accounting for
the cost of inventory and calculating the cost of goods sold:
A1. Periodic FIFO
A2. Periodic LIFO
A3. Periodic Average
B1. Perpetual FIFO
B2. Perpetual LIFO
B3. Perpetual Average
A2. Periodic LIFO
A3. Periodic Average
B1. Perpetual FIFO
B2. Perpetual LIFO
B3. Perpetual Average
A1. Periodic FIFO
"Periodic" means that the Inventory account
is not routinely updated during the accounting period. Instead, the cost of
merchandise purchased from suppliers is debited to an account called Purchases.
At the end of the accounting year the Inventory account is adjusted to equal
the cost of the merchandise that has not been sold. The cost of goods sold that
will be reported on the income statement will be computed by taking the cost of
the goods purchased and subtracting the increase in inventory (or adding the
decrease in inventory).
"FIFO"
is an acronym for First In, First Out. Under the FIFO cost flow assumption, the first
(oldest) costs are the first ones to leave inventory and become the cost of
goods sold on the income statement. The last (or recent) costs will be reported
as inventory on the balance sheet.
Remember that the costs can flow differently than the
goods. If the Corner Shelf Bookstore uses FIFO, the owner may sell the newest
book to a customer, but is allowed to report the cost of goods sold as $85 (the
first, oldest cost).
Let's illustrate periodic FIFO with the amounts from
the Corner Shelf Bookstore:

As before, we need to account for the total goods
available for sale (5 books at a cost of $440). Under FIFO we assign the first
cost of $85 to the one book that was sold. The remaining $355 ($440 - $85) is
assigned to inventory. The $355 of inventory costs consists of $87 + $89 + $89
+ $90. The $85 cost assigned to the book sold is permanently gone from
inventory.
If Corner Shelf Bookstore sells
the textbook for $110, its gross profit under periodic
FIFO will be $25 ($110 - $85). If the costs of textbooks continue to increase,
FIFO will always result in more profit than other cost flows, because the first
cost is always lower.
A2. Periodic LIFO
"Periodic" means that
the Inventory account is not updated during the accounting period.
Instead, the cost of merchandise purchased from suppliers is debited to an
account called Purchases. At the end of the accounting year the Inventory
account is adjusted to equal the cost of the merchandise that is unsold. The
other costs of goods will be reported on the income statement as the cost of
goods sold.
"LIFO" is an acronym for Last In, First Out. Under the LIFO cost flow
assumption, the last (or recent) costs are the first ones to leave inventory
and become the cost of goods sold on the income statement. The first (or
oldest) costs will be reported as inventory on the balance sheet.
Remember that the costs can flow differently than the
goods. In other words, if Corner Shelf Bookstore uses LIFO, the owner may sell
the oldest (first) book to a customer, but can report the cost of goods sold of
$90 (the last cost).
It's important to note that under LIFO
periodic (not
LIFO perpetual) we wait until the entire year is over before assigning the
costs. Then we flow the year's last costs first, even if those goods arrived after the last sale of the year. For example, assume the
last sale of the year at the Corner Shelf Bookstore occurred on December 27.
Also assume that the store's last purchase of the year arrived on December 31.
Under LIFO periodic, the cost of the book purchased on December 31 is sent to
the cost of goods sold first, even though it's physically
impossible for that book to be the one sold on December 27. (This reinforces
our previous statement that the flow of costs does not have to correspond with
the physical flow of units.)
Let's illustrate periodic LIFO by using the data for
the Corner Shelf Bookstore:

As before we need to account for the total goods
available for sale: 5 books at a cost of $440. Under periodic LIFO we assign
the last cost of $90 to the one book that was sold. (If two books were sold,
$90 would be assigned to the first book and $89 to the second book.) The
remaining $350 ($440 - $90) is assigned to inventory. The $350 of inventory
cost consists of $85 + $87 + $89 + $89. The $90 assigned to the book that was
sold is permanently gone from inventory.
If the bookstore sold the
textbook for $110, its gross profit under
periodic LIFO will be $20 ($110 - $90). If the costs of textbooks continue to
increase, LIFO will always result in the least amount of profit. (The reason is
that the last costs will always be higher than the first costs. Higher costs
result in less profits and usually lower income taxes.)
A3. Periodic Average
Under "periodic" the
Inventory account is not updated and purchases of merchandise are recorded in
an account called Purchases. Under this cost flow assumption an average cost is
calculated using the total goods available for sale (cost from the beginning
inventory plus the costs of all subsequent
purchases made during the entire year). In other words, the periodic average
cost is calculated after the year is over—after all the purchases of the year
have occurred. This average cost is then applied to the units sold during the
year as well as to the units in inventory at the end of the year.
As you can see, our facts remain
the same-there are 5 books available for sale for the year 2014 and the cost of
the goods available is $440. The weighted
average cost of
the books is $88 ($440
of cost of goods available ÷ 5 books available) and it is used for both the
cost of goods sold and for the cost of the books in inventory.

Since the bookstore sold only one
book, the cost of goods sold is $88 (1
x $88). The four books still on hand are reported at $352 (4 x $88) of cost in the Inventory account. The total
of the cost of goods sold plus the cost of the inventory should equal the total
cost of goods available ($88 + $352 = $440).
If Corner Shelf Bookstore sells the textbook for $110,
its gross profit under the periodic average method will be $22 ($110 - $88).
This gross profit is between the $25 computed under periodic FIFO and the $20
computed under periodic LIFO.
Perpetual FIFO
Under the perpetual system the Inventory account is constantly (or perpetually) changing. When
a retailer purchases merchandise, the retailer debits its Inventory account for
the cost; when the retailer sells the merchandise to its customers its
Inventory account is credited and its Cost of Goods Sold account
is debited for the cost of the goods sold. Rather than staying dormant as it does with the periodic method, the Inventory
account balance is continuously updated.
Under the perpetual system, two
transactions are recorded when merchandise is sold: (1) the sales amount is
debited to Accounts Receivable or Cash and is credited to Sales, and (2) the cost of the merchandise sold is debited to
Cost of Goods Sold and is credited to Inventory. (Note: Under the periodic
system the second entry is not made.)
With perpetual FIFO, the first (or oldest) costs are
the first moved from the Inventory account and debited to the Cost of Goods
Sold account. The end result under perpetual FIFO is the same as under periodic
FIFO. In other words, the first costs are the same whether you move the cost
out of inventory with each sale (perpetual) or whether you wait until the year
is over (periodic).
B2. Perpetual LIFO
Under the perpetual system the
Inventory account is constantly (or perpetually) changing. When a retailer
purchases merchandise, the retailer debits its Inventory account for the cost
of the merchandise. When the retailer sells the merchandise to its customers,
the retailer credits its Inventory account for the cost of the goods that were
sold and debits its Cost of Goods Sold account for their cost. Rather than
staying dormant as
it does with the periodic method, the Inventory account balance is continuously
updated.
Under the perpetual system, two transactions are
recorded at the time that the merchandise is sold: (1) the sales amount is
debited to Accounts Receivable or Cash and is credited to Sales, and (2) the
cost of the merchandise sold is debited to Cost of Goods Sold and is credited
to Inventory. (Note: Under the periodic system the second entry is not made.)
With perpetual LIFO, the last
costs available at the time of the sale are the first to be removed from the Inventory account
and debited to the Cost of Goods Sold account. Since this is the perpetual system we cannot wait until the end of the year to
determine the last cost—an entry must be recorded at
the time of the sale in
order to reduce the Inventory account and to increase the Cost of Goods Sold
account.
If costs continue to rise
throughout the entire year, perpetual LIFO
will yield a lower cost of goods sold and a higher net income than periodic LIFO. Generally this means that periodic LIFO will result in less income taxes than perpetual LIFO. (If you wish to minimize the amount paid in
income taxes during periods of inflation, you should discuss LIFO with your tax
adviser.)
Once again we'll use our example for the Corner Shelf
Bookstore:

Let's assume that after Corner Shelf makes its second purchase in June 2014,
Corner Shelf sells one book. This means the last cost at the
time of the sale was
$89. Under perpetual LIFO the following entry must be made at the time of the
sale: $89 will be credited to Inventory and $89 will be debited to Cost of
Goods Sold. If that was the only book sold during the year, at the end of the
year the Cost of Goods Sold account will have a balance of $89 and the cost in
the Inventory account will be $351 ($85
+ $87 + $89 + $90).
If the bookstore sells the textbook
for $110, its gross profit under
perpetual LIFO will be $21 ($110 - $89). Note that this is different than the
gross profit of $20 under periodic LIFO.
B3. Perpetual Average
Under the perpetual system the
Inventory account is constantly (or perpetually) changing. When a retailer
purchases merchandise, the costs are debited to its Inventory account; when the
retailer sells the merchandise to its customers the Inventory account is credited
and the Cost of Goods Sold account is debited for the cost of the goods sold.
Rather than staying dormant as
it does with the periodic method, the Inventory account balance under the
perpetual average is changing whenever a purchase or sale occurs.
Under the perpetual system, two sets of entries are
made whenever merchandise is sold: (1) the sales amount is debited to Accounts
Receivable or Cash and is credited to Sales, and (2) the cost of the
merchandise sold is debited to Cost of Goods Sold and is credited to Inventory.
(Note: Under the periodic system the second entry is not made.)
Under the perpetual system,
"average" means the average cost
of the items in inventory as of the date of the sale.
This average cost is multiplied by the number of units sold and is removed from
the Inventory account and debited to the Cost of Goods Sold account. We use the
average as of the time of the sale because this is aperpetual method. (Note: Under the periodic system we wait until the year is over before computing
the average cost.)
Let's use the same example again for the Corner Shelf
Bookstore:
Let's assume that after Corner
Shelf makes its second purchase, Corner Shelf sells one book. This means the
average cost at the time of the sale was $87.50 ([$85
+ $87 + $89 + $89] ÷ 4]). Because this is a perpetual average, a journal entry
must be made at the time of the sale for $87.50. The $87.50 (the average cost
at the time of the sale) is credited to Inventory and is debited to Cost of
Goods Sold. After the sale of one unit, three units remain in inventory and the
balance in the Inventory account will be $262.50 (3 books at an average cost of
$87.50).
After Corner Shelf makes its
third purchase, the average cost per unit will change to $88.125 ([$262.50 + $90] ÷ 4). As you can see, the average
cost moved from $87.50 to $88.125—this is why the perpetual average method is
sometimes referred to as the moving average method.
The Inventory balance is $352.50 (4
books with an average cost of $88.125 each).
Comparison of Cost Flow Assumptions
Below is a recap of the varying amounts for the cost
of goods sold, gross profit, and ending inventory that were calculated above.
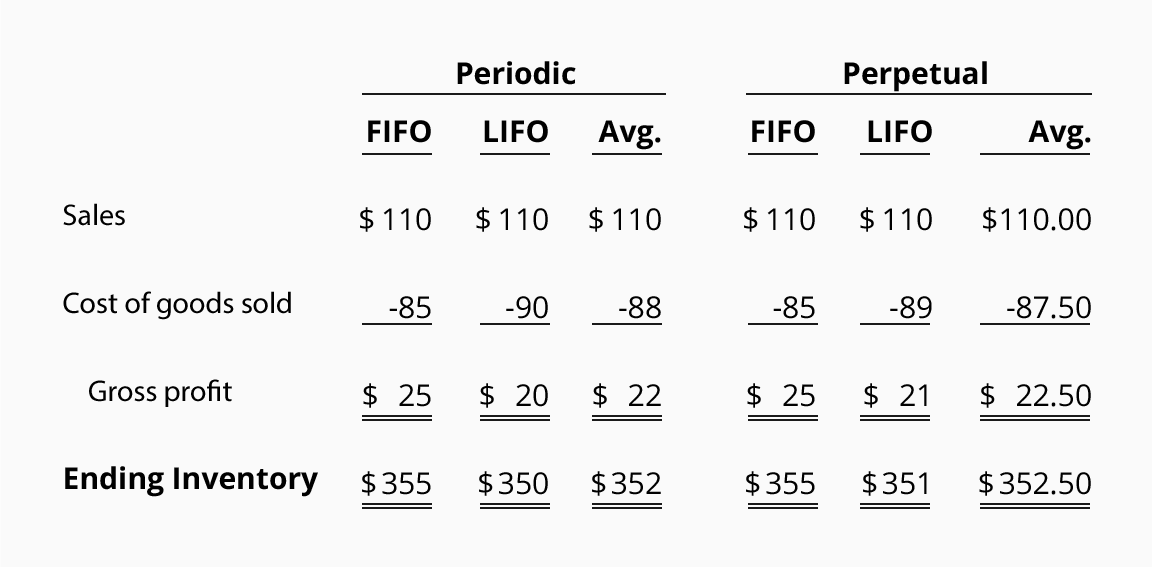
The example assumes that costs were continually
increasing. The results would be different if costs were decreasing or
increasing at a slower rate. Consult with your tax advisor concerning the
election of cost flow assumption.
Specific Identification
In addition to the six cost flow
assumptions presented in Parts 1 - 4, businesses have another option: expense
to the cost of goods sold the specific cost
of the specific item
sold. For example, Gold Dealer, Inc. has an inventory of gold and each nugget
has an identification number and the cost of the nugget. When Gold Dealer sells
a nugget, it can expense to the cost of goods sold the exact cost of the
specific nugget sold. The cost of the other nuggets will remain in inventory.
(Alternatively, Gold Dealer could use one of the other six cost flow
assumptions described in Parts 1 - 4.)
LIFO Benefits Without Tracking Units
In Part 1 and Part 2 you saw that during the periods
of increasing costs, LIFO will result in less profits. In the U.S. this can
mean less income taxes paid by the company. Most companies view lower taxes as
a significant benefit. However, the process of tracking costs and then
assigning those costs to the units sold and the units on hand could be too
expensive for the amount of income tax savings. To gain the benefit of LIFO
without the tracking of costs, there is a method known as dollar value LIFO.
This topic is discussed in intermediate accounting textbooks. The Internal
Revenue Service also allows companies to use dollar value LIFO by applying
price indexes. (You should seek the advice of an accounting and/or tax
professional to assess the cost and benefit of these techniques.)
Inventory Management
Over the past few decades sophisticated companies have
made great strides in reducing their levels of inventory. Rather than carry
large inventories, they ask their suppliers to deliver goods "just in time."
Suppliers and merchandisers have learned to coordinate their purchases and
sales so that orders and shipments occur automatically.
A company will realize significant benefits if it can
keep its inventory levels down without losing sales or production (if the
company is a manufacturer). For example, Dell Computers has greatly reduced its
inventory in relationship to its sales. Since computer components have been
dropping in costs as new technologies emerge, it benefits Dell to keep only a
very small inventory of components on hand. It would be a financial hardship if
Dell had a large quantity of parts that became obsolete or decreased in value.
Financial Ratios
Keeping track of inventory is
important. There are two common financial ratios for monitoring inventory
levels: (1) the Inventory Turnover Ratio, and (2) the Days' Sales in Inventory.
(These are discussed and illustrated in the Explanation of Financial Ratios.)
Estimating Ending Inventory
It is very time-consuming for a
company to physically count
the merchandise units in its inventory. In fact, it is not unusual for
companies to shut down their operations near the end of their accounting year
just to perform inventory counts. The company may assign one set of employees
to count and tag the items and another set to verify the counts. If a company
has outside auditors, they will be there to observe the process. (Even if the
company's computers keep track of inventory, accountants require that the
computer records be verified by actually counting the goods.)
If a company counts its inventory
only once per year it must estimate its
inventory at the end of each month in order to prepare meaningful monthly
financial statements. In fact, a company may need to estimate its inventory for
other reasons as well. For example, if a company suffers a loss due to a
disaster such as a tornado or a fire, it will need to file a claim for the
approximate cost of the inventory that was lost. (An insurance adjuster will
also compute this amount independently so that the company is not paid too much
or too little for its loss.)
Methods of Estimating Inventory
There are two methods for estimating ending inventory:
1. Gross Profit Method
2. Retail Method
2. Retail Method
1. Gross Profit Method.
The gross profit method for estimating inventory uses the information contained
in the top portion of a merchandiser's multiple-step income statement:
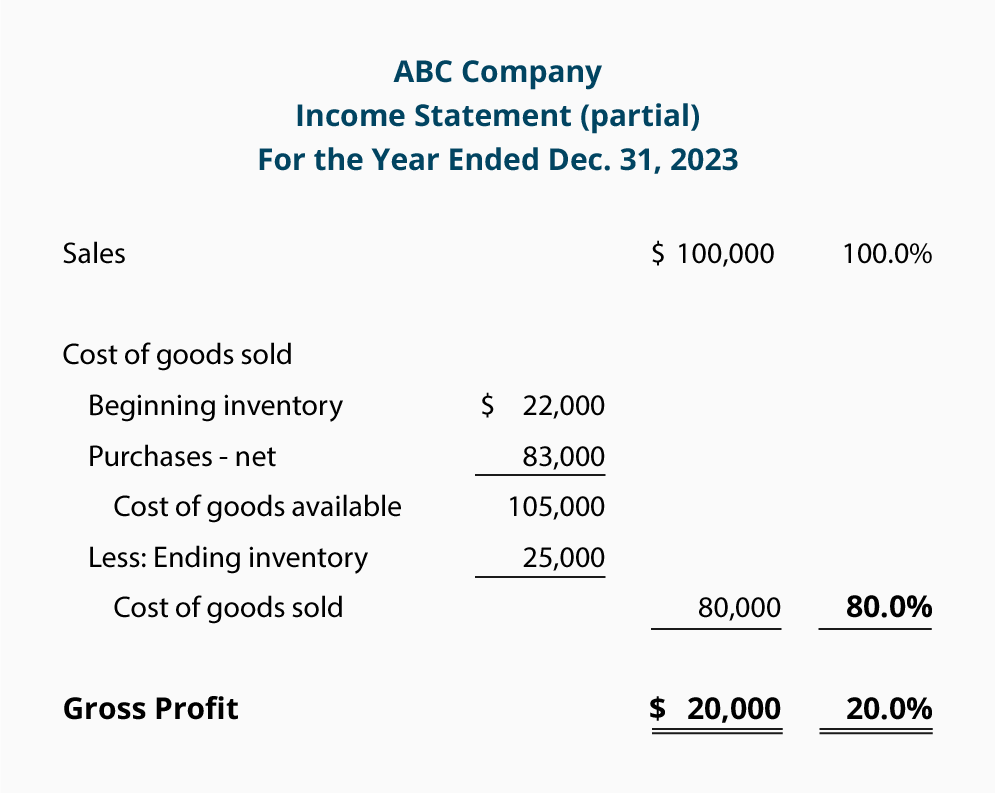
Let's assume that we need to estimate the cost of inventory on hand on June 30, 2014. From
the 2013 income statement shown above we can see that the company's gross
profit is 20% of the sales and that the cost of goods sold is 80% of the sales.
If those percentages are reasonable for the current year, we can use those
percentages to help us estimate the cost of the inventory on hand as of June
30, 2014.
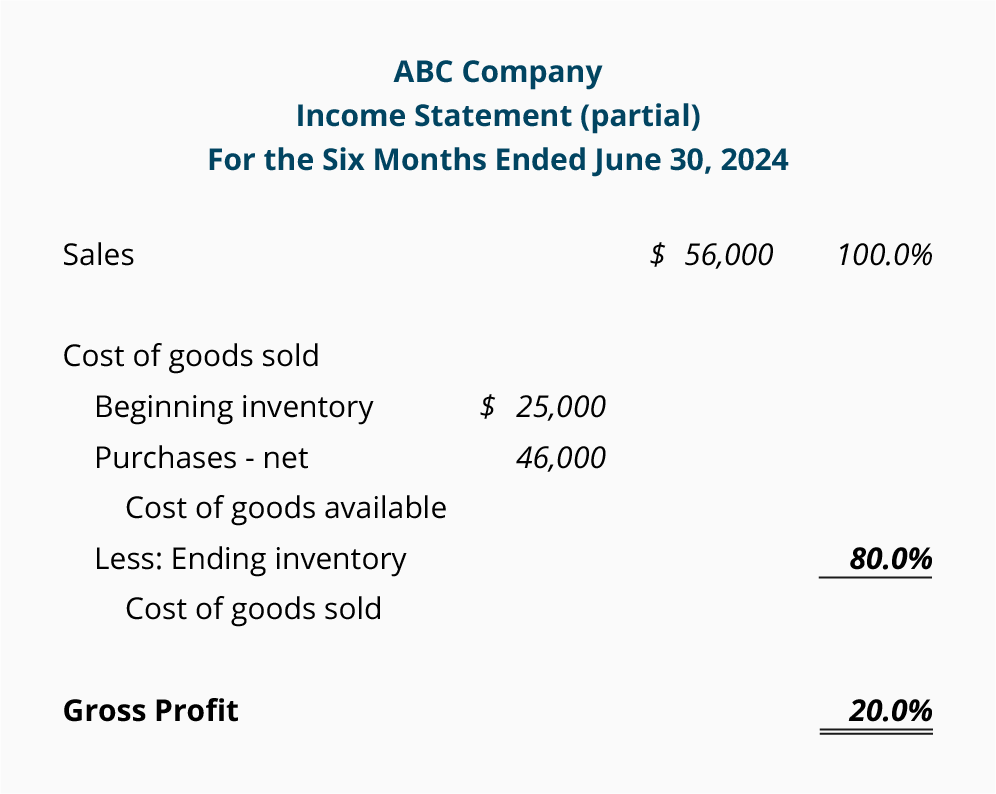
While an algebraic equation could be constructed to
determine the estimated amount of ending inventory, we prefer to simply use the
income statement format. We prepare a partial income statement for the period
beginning after the date when inventory was last physically counted, and ending
with the date for which we need the estimated inventory cost. In this case, the
income statement will go from January 1, 2014 until June 30, 2014.
Some of the numbers that we need are easily obtained
from sales records, customers, suppliers, earlier financial statements, etc.
For example, sales for the first half of the year 2014 are taken from the
company's records. The beginning inventory amount is the ending inventory
reported on the December 31, 2013 balance sheet. The purchases information for
the first half of 2014 is available from the company's records or its
suppliers. The amounts that we have available are written in italics in the
following partial income statement:
We will fill in the rest of the
statement with the answers to the following calculations. The amounts in italics come from the statement above. The bold amount is the
answer or result of the calculation.
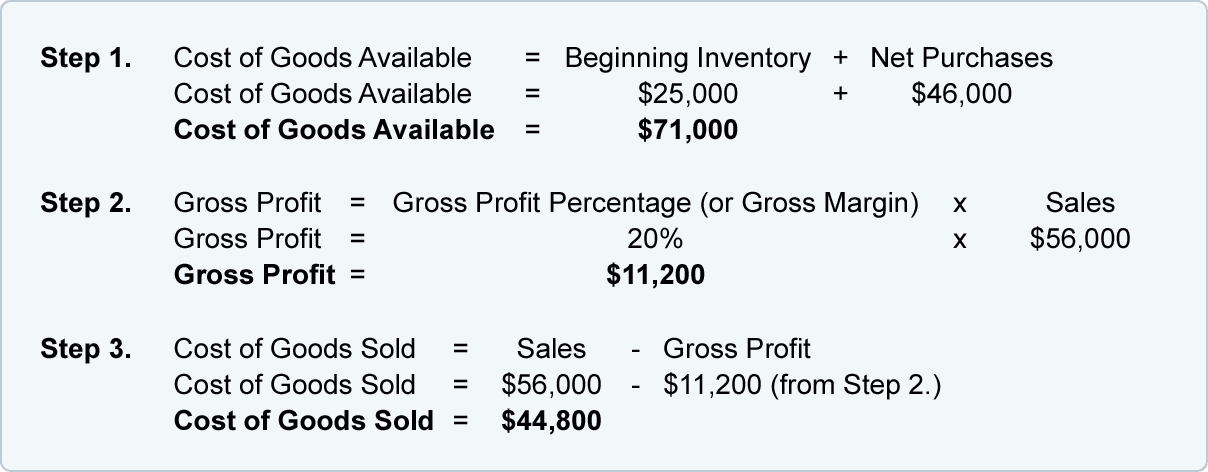
This can also be calculated as 80% x Sales of $56,000
= $44,800.
Inserting this information into the income statement
yields the following:
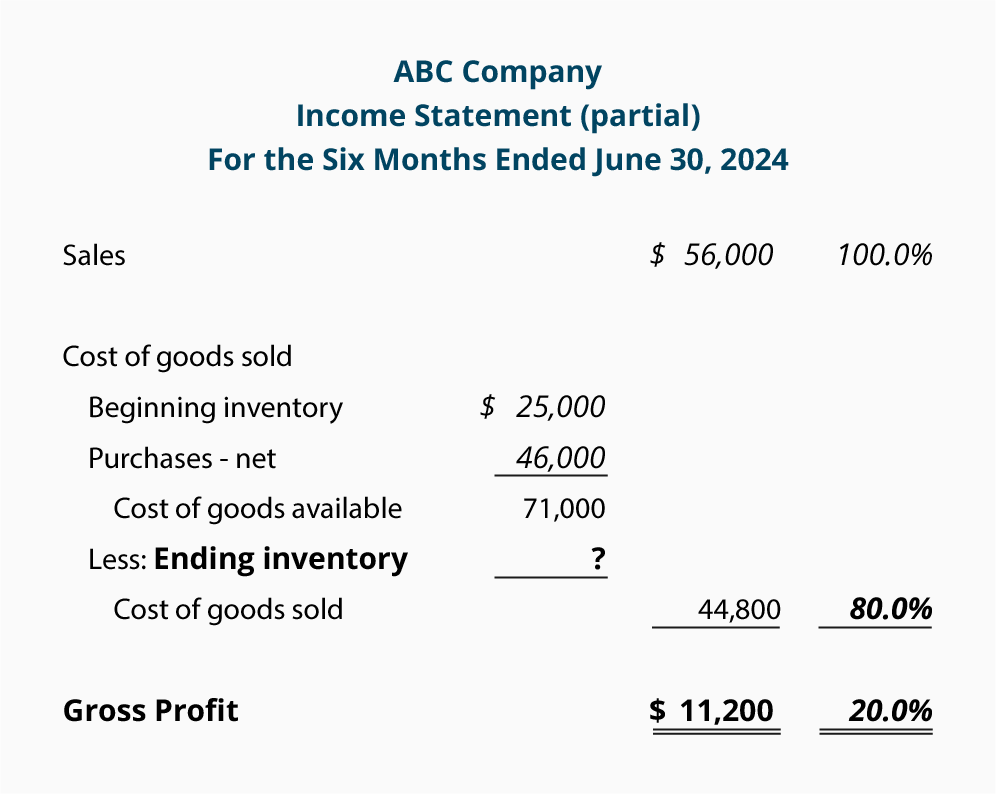
As you can see, the ending inventory amount is not yet
shown. We compute this amount by subtracting cost of goods sold from the cost
of goods available:
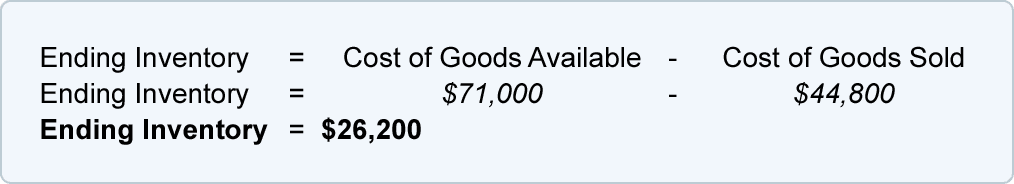
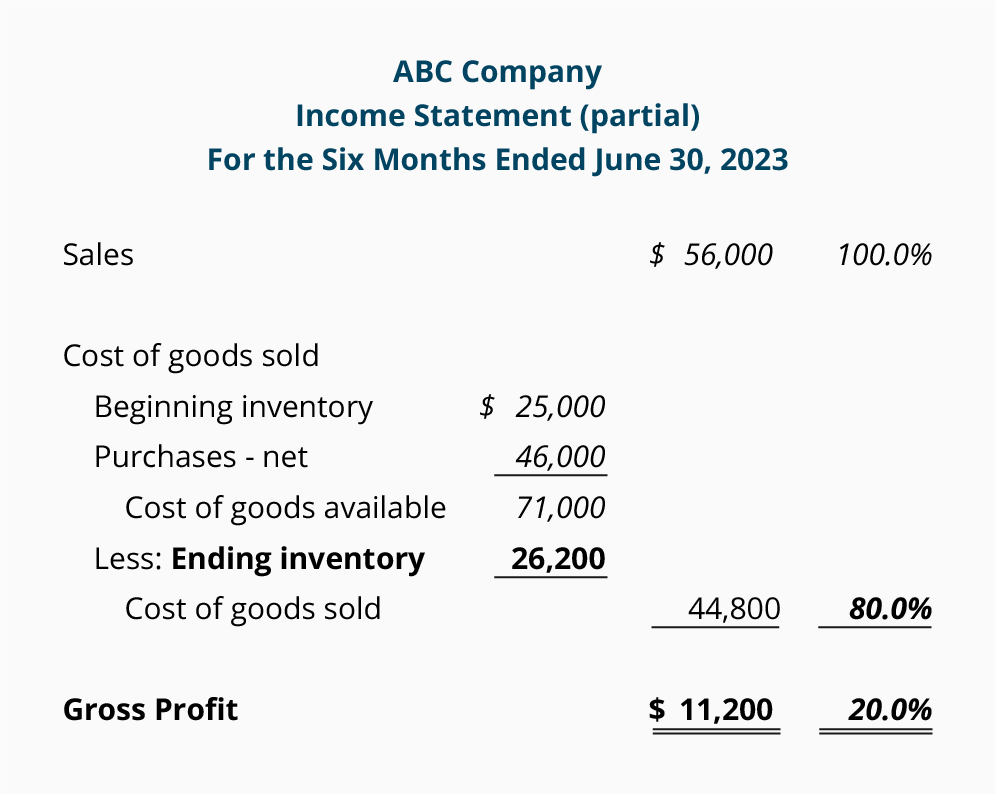
Below is the completed partial income statement with
the estimated amount of ending inventory at $26,200. (Note: It is always a good
idea to recheck the math on the income statement to be certain you computed the
amounts correctly.)
2. Retail Method. The
retail method can be used by retailers who have their merchandise records in
both cost and retail selling prices. A very simple illustration for using the
retail method to estimate inventory is shown here:
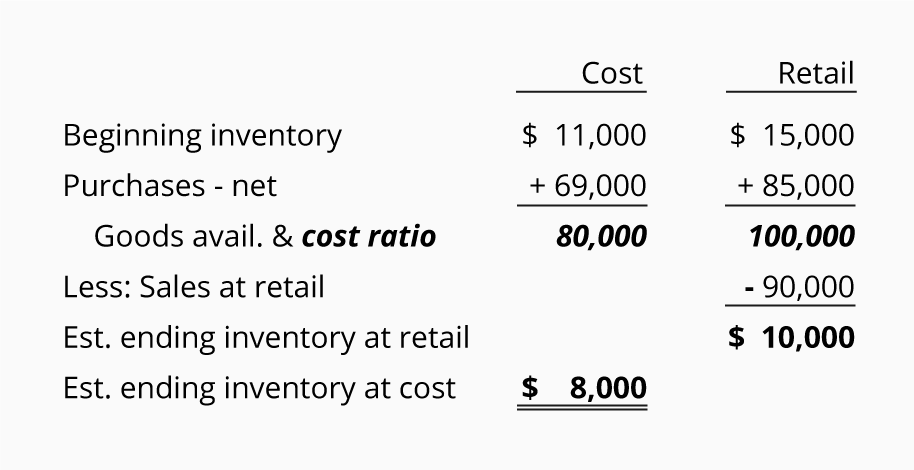
As you can see, the cost amounts are arranged into one column. The retail amounts are listed in a separate column. The Goods
Available amounts are used to compute the cost-to-retail ratio. In this case
the cost of goods available of $80,000 is divided by the retail amount of goods
available ($100,000). This results in a cost-to-retail ratio, or cost ratio, of
80%.
To arrive at the estimated ending
inventory at cost, we multiply the estimated ending inventory at retail
($10,000) times the cost ratio of 80%
to arrive at $8,000.
Additional Information and
Resources
Because the material covered here
is considered an introduction to this topic, many complexities have been
omitted. You should always consult with an accounting professional for
assistance with your own specific circumstances.
Subscribe to:
Comments (Atom)